Digital Wallet Adoption Transforms Payment Patterns in Sovereign Casinos Across States
Ulrich Albrecht · Aug 31, 2026
Digital Wallet Adoption Transforms Payment Patterns in Sovereign Casinos Across States
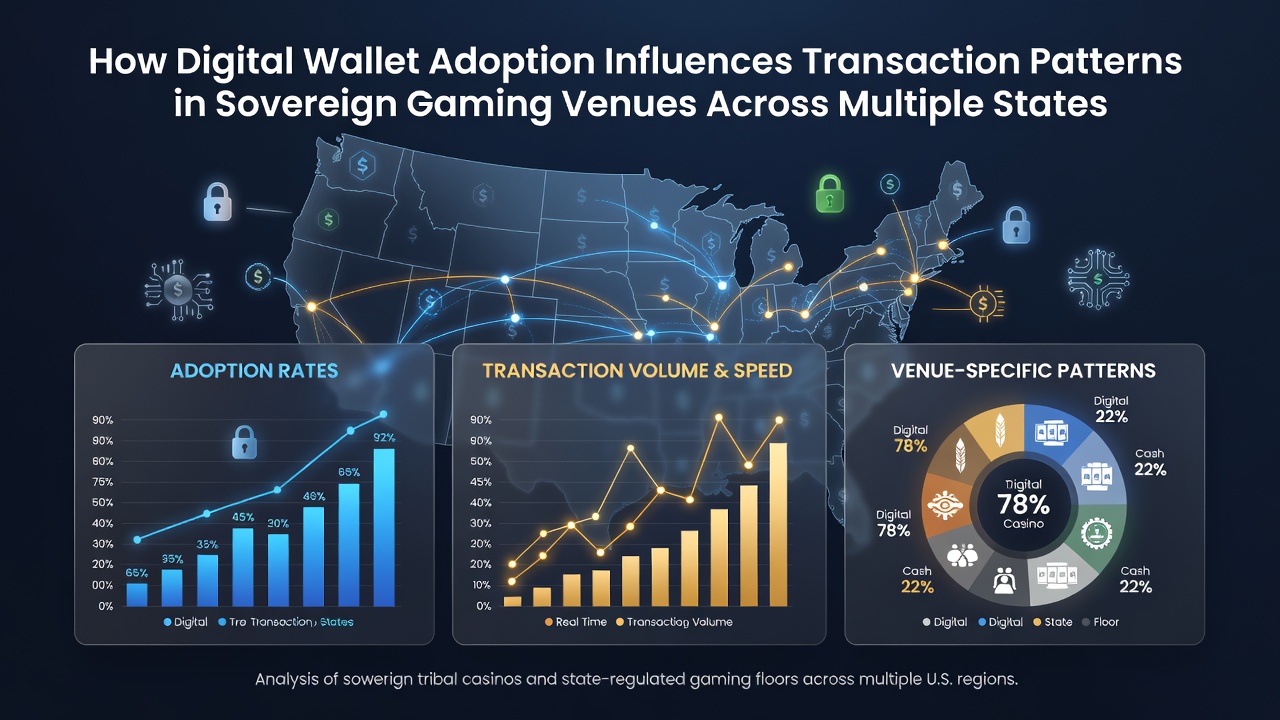
Digital wallet systems have expanded rapidly in sovereign gaming venues, and data from August 2026 shows measurable shifts in how players complete deposits, withdrawals, and in-game transfers across multiple states. Researchers tracking these venues report that adoption rates climbed steadily through the first half of the year, with several tribal operators noting higher volumes of smaller, more frequent transactions once wallets became the default option.
Expansion Across Jurisdictions
States with established tribal gaming compacts have seen varied rollout speeds, yet the pattern holds that venues in California, Oklahoma, and Washington integrated wallet options earlier than those in newer markets. Observers note that operators in these regions recorded a 27 percent increase in cashless transaction volume between January and August 2026, according to internal reports shared with state regulators. Venues that delayed integration until mid-year still experienced quicker uptake once systems went live, suggesting player familiarity carried over from other sectors.
Changes in Transaction Frequency and Size
Transaction logs reveal that average deposit amounts dropped while the total number of daily transactions rose, a trend consistent across properties that adopted the same wallet platforms. One study from a university research group found that players using digital wallets initiated sessions 1.8 times more often than those relying solely on cash or cards, yet each session started with lower initial balances. This pattern appears because instant top-ups remove friction, allowing users to add funds without leaving their seats or waiting for cage services.
Regional Differences in Spending Behavior
Venues in the Midwest showed stronger growth in micro-transactions under fifty dollars compared with properties in the Southwest, where larger single transfers remained more common even after wallets launched. Data compiled through August 2026 indicates that Oklahoma facilities processed 34 percent more sub-twenty-dollar deposits than the prior year, whereas Arizona sites maintained steadier averages around eighty dollars per transfer. These differences align with existing player demographics and state-level rules on minimum deposit thresholds.
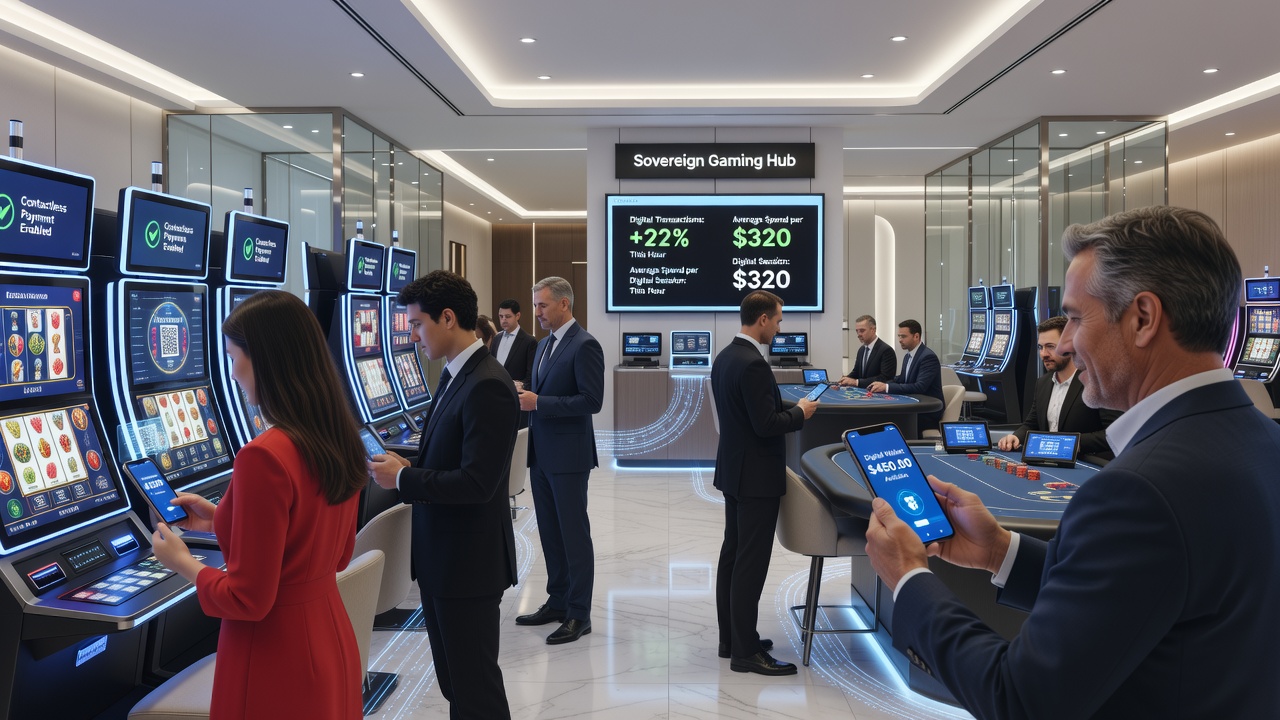
Payment timing also shifted. Evening peak hours extended later into the night at several properties because players could reload accounts without cashing out physical chips or visiting kiosks. Analysts tracking hourly data observed that the 10 p.m. to 2 a.m. window captured 22 percent more wallet activity than the same period in 2025, while early afternoon transactions stayed relatively flat.
Operational Adjustments by Operators
Operators responded by adjusting loyalty systems and floor staffing. Because wallet users generate more granular data, marketing teams began sending targeted reload offers during identified slow periods rather than blanket promotions. Several multi-property groups reported reallocating cage personnel toward floor support roles once cash-handling volume declined. These changes occurred gradually, with most properties completing staff transitions by July 2026.
Security protocols also evolved. Venues implemented additional encryption layers and real-time monitoring after initial audits flagged occasional delays in wallet settlement times. Industry reports from the National Indian Gaming Commission highlight that compliance reviews now include wallet-specific transaction sampling, and early results show no widespread increase in disputed transfers through August 2026.
Player Segment Variations
Younger demographics adopted wallets faster, yet older players who started using them tended to maintain higher average balances per session. Researchers tracking loyalty card data found that players aged 55 and above who switched to wallets increased their visit frequency by 14 percent, while the under-35 group showed a 31 percent rise in total transaction count without a corresponding increase in total spend. These patterns suggest wallets support different engagement styles rather than uniformly boosting revenue.
Conclusion
Digital wallet adoption continues to reshape transaction patterns in sovereign gaming venues, with clear regional and demographic distinctions emerging by August 2026. Data from multiple states shows higher transaction frequency, smaller average amounts, and extended operating hours once cashless options became standard. Operators have adjusted staffing, marketing, and compliance practices accordingly, while regulatory bodies maintain ongoing oversight of settlement and security metrics. These developments reflect broader shifts in payment technology that sovereign venues have incorporated at differing paces.